ea编程网
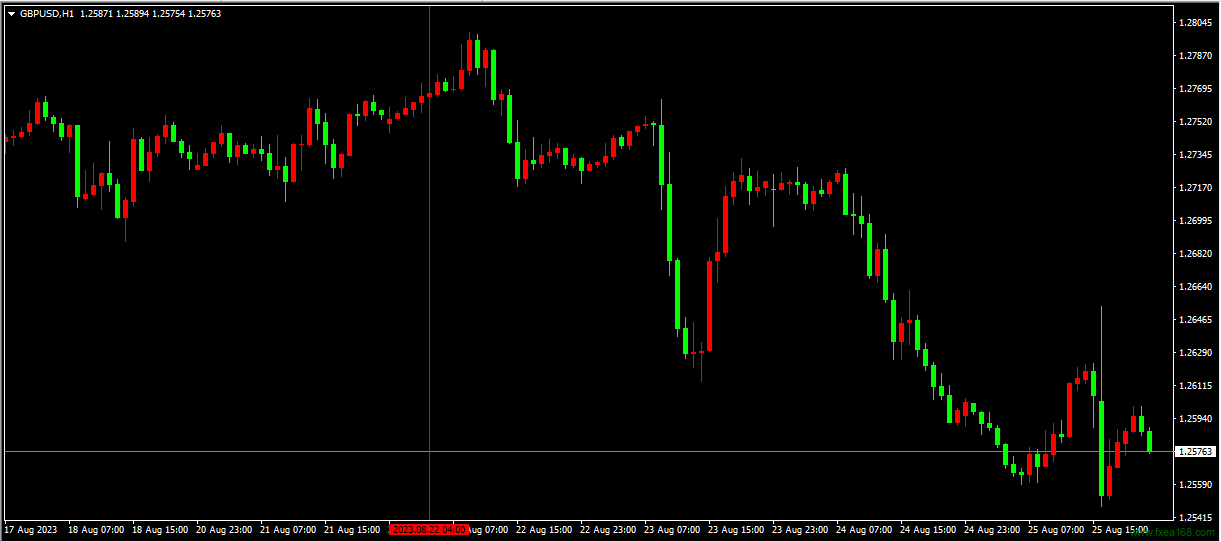
ea编程网在交易分析中,垂直线常用于标识特定的时刻或事件。为了满足这一需求,我们提供了三个核心的函数:VLineCreate、VLineMove和VLineDelete。在本文中,我们将详细介绍这三个函数的功能和用法。
1. VLineCreate:创建垂直线
该函数用于在图表上创建一个新的垂直线。它包含了多个参数,使您能够自定义线的名称、颜色、风格等。
函数原型:
bool VLineCreate(const long chart_ID=0,
                 const string name="VLine",
                 const int sub_window=0,
                 datetime time=0,
                 const color clr=clrRed,
                 const ENUM_LINE_STYLE style=STYLE_SOLID,
                 const int width=1,
                 const bool back=false,
                 const bool selection=true,
                 const bool hidden=true,
                 const long z_order=0);
示例:创建一个红色的虚线垂直线:
VLineCreate(0, "SampleVLine", 0, TimeCurrent(), clrRed, STYLE_DASH, 1);2. VLineMove:移动垂直线
一旦创建了垂直线,如果需要将其移到另一个日期或时间点,可以使用VLineMove函数。
函数原型:
bool VLineMove(const long chart_ID=0,
               const string name="VLine",
               datetime time=0);
示例:将已创建的垂直线移动到当前时刻:
VLineMove(0, "SampleVLine", TimeCurrent());3. VLineDelete:删除垂直线
如果您不再需要图表上的某个垂直线,可以使用VLineDelete函数轻松删除它。
函数原型:
bool VLineDelete(const long chart_ID=0,
                 const string name="VLine");
示例:删除名为”SampleVLine”的垂直线:
VLineDelete(0, "SampleVLine");总结
垂直线在交易图表分析中扮演着重要的角色,无论是突出显示某个事件,还是标记某一时间点。通过上述三个函数,我们能够轻松、高效地在图表上操作垂直线。当然,为了更好地利用这些功能,建议您进一步实践和深入了解MQL4编程。希望本文提供的信息能够帮助您更好地进行交易分析和策略开发。